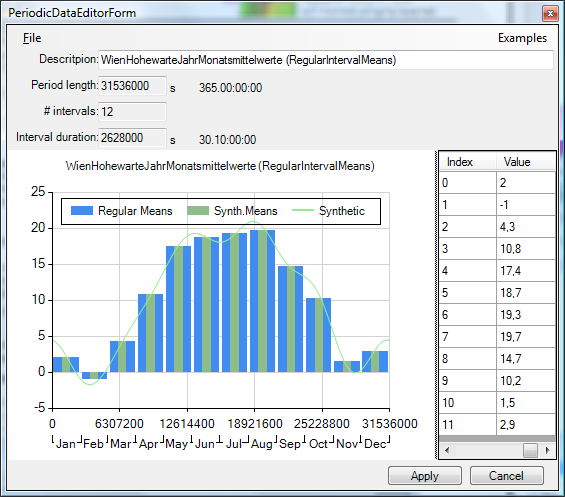
Periodic / Harmonic Data Editor
The Periodic / Harmonic Data Editor window provides the means of creating, editing and managing periodic climate data required as boundary conditions to transient evaluation.
| TRANSIENT-option: Solving and evaluating time dependant dynamic, periodic problems when heat capacity effects are concerned is only possible with an active TRANSIENT-Option of the program. |
 |
The Periodic / Harmonic Data Editor will be used out of the Boundary Conditions window when transient problem is to be evaluated and time dependant boundary conditions are needed for that purpose. For convenient managing periodic data sets it us available from a Tools Menu also.
There are following types of data which could by managed within Periodic / Harmonic Data Editor:
- Constant
- Regular Points
- Regular Means
- Irregular Means
- Irregular Steps
- Harmonic Coefficients.
The window contains three parts:
- File & Examples Menu
- Info
- Graph
- Data Grid
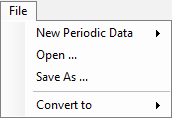 File Menu:
- New - create new data set of the specific part. A dialog is shown to provide the information required for specific type (see "Info Part").
- Open/Save/Save As... - provides the file access to the data (.PeriodicData, .ConstantValuePeriodic, .RegularPointsPeriodic, .IrregularStepsPeriodic, .IrregularMeansPeriodic, .RegularMeansPeriodic, .HarmonicPeriodic,)
- Convert To... - allows simple synthetic conversions between selected periodic data types.
Info Part:
The Info part displays the characteristic information for the dataset being processed. Depending on the type of data
different information is displayed and eventually available to input.
The initial specific values are supplied during the creation of the data set (File->New...) and a limited set of them, depending
on the data type processed, can be changed later.
- Description identifying the data
- Period Length (in seconds)
- Number of Intervals
- Number of Points
- Interval Duration (in seconds)
Graph Chart Part:
The graph chart represents and displays the input data along with its synthetic variant resulting from harmonic Fourier analysis and synthesis.
Zoom with lasso is possible by clicking in the graph with the left mouse button and dragging the cursor to another position. With the right mouse button it is possible to reset the zoom.
The legend provides the identification of patterns shown. A double click on to the legend will change its position relative to the chart area (right, left, top, bottom).
Data points can be selected.
Data points (or bars) can be dragged changing the value (press ESC to abort the unintentional drag operation an revert to the previous value).
| MULTICORE-option: Speeding up computationally intensive jobs by distributing them on multiple processors or processor cores for parallel execution is only possible with an active MULTICORE-Option of the program. |
 |
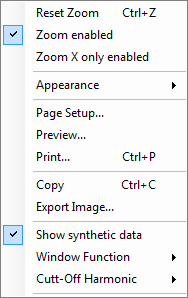 Context menu of the Graph Chart:
- Reset Zoom
- Zoom enabled
- Zoom X only enabled
- Appearance
- Page Setup...
- Preview...
- Print...
- Copy
- Export Image...
- Show synthetic data
- Window Function
- Cut-Off Harmonic
| Window Function (Gibbs Effect) |
Selection of the windowing filter function to reduce the Gibbs effect (e.g. while working with switch
functions "IrregularIntervalSteps" or dense data with high value changes).
|
| Cut-Off Harmonic | Limits the number of harmonics for the Fourier syntheis. |
Data Grid Part:
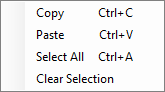 The data is input into the Value column.
The native Copy & Paste of the selected cell(s) is provided.
Capability to paste data from/to the Value column streamlines the input procedure (also available via Context Menu). All numbers contained in the paste buffer (regardless if column(s) or row(s)) will be parsed as double entities (entries in error and not parse able as such in be ignored) and transferred in the order to the value column.