Graphic results
Graphic results will be obtained in the sophisticated Results-3D-View which is commonly used for two- and three-dimensional output. If yet not visible go to the view menu and select Results 3D View to reveal the graphics evaluation window.
Cause we currently analyse a two-dimensional case, make sure perspective view is turned off in the general panel shown. Also you can turn full opacity of the surface with the surface panel.
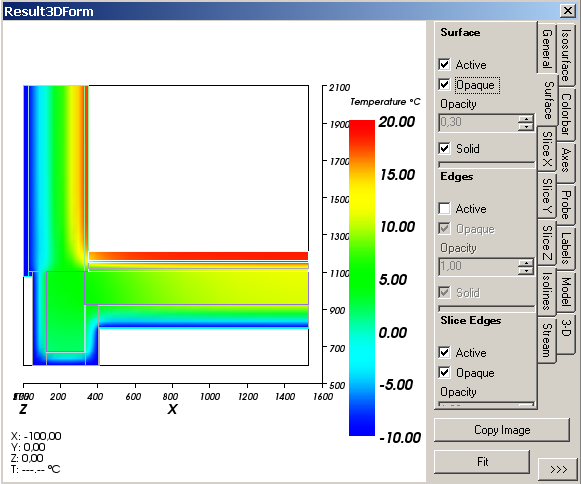
To pass the image for farther processing, press Copy Image. The image is being placed into the clipboard from where you can insert it into any application for report generation or high quality printing. You can adjust the size of the image produced within application settings of the edit menu.
Isolines (Isotherms)
Next, a rendering of the temperature distribution in the form of isotherms shall be generated using the panel Isolines (for Isotherms).
Cause Isolines plotted will be plotted over the surface already visible thus rendering them in the same color would make them invisible, let the surface be fully transparent by deselecting "Opaque" and changing the opacity to 0 on the surface panel.
After selecting "Active" on the Isolines panel, enter 2.0 for the step (interval) specification.
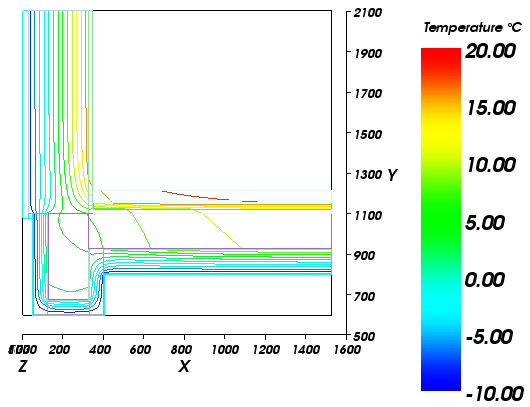
To pass the image for further processing via clipboard use either Copy Image or Edit Menu→Copy.
Annotated (Labelled) Isolines (Isotherms)
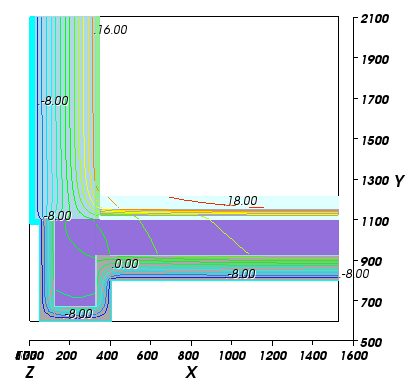
Next, a rendering of the temperature distribution in the form of annotated (labelled) isotherms shall be generated using the Z Slice.
Since the Slice placed "within" the construction it would render invisible if the surface would not be turned off. Therefore on the surface panel make the surface inactive by turning it off.
On Slice Z panel select the value of 500.
The slice surface is also coloured. To reveal isotherms only, make the slice fully transparent by turning its opacity value to 0.00.
On the labels panel adjust the label distance and size parameters.
To reveal the structure of materials within the model, now shown as lines only, select Model Slices to be Solid on the Model Panel.
Streamline analysis
Before going to the streamline analysis, turn Model completely off (both Model and Model Slices).
Using the Slice X and Slice Y controls place the crossing of both somewhere within the construction revealing the streamline. On the Streamline panel make the tube radius larger to emphasize the streamline shown.
You can optionally turn Isolines or Labels off for less obscured representation.
Streamline analysis - multiple streamlines (2D only)
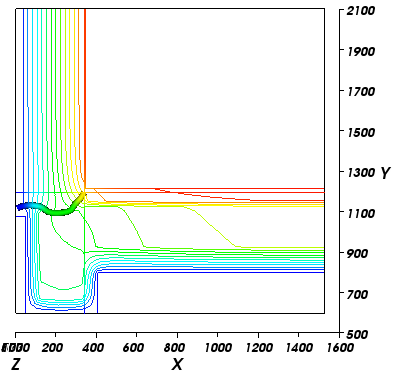
There is also an option to show multiple streamlines at the Z-Slice of this
2-dimensional model. To achieve this select "Start at: Space Boundary" option on
the Streamline panel. By default the heat flow of the first room is subdivided
into 5 intervals. At boundaries of this intervals streamlines are drawn.
The diagram below was drawn with 50 intervals for heat flowing into exterior space.
Changing the tube radius of streamlines to 0 renders them as thin lines. Turn
colorize of streamlines to black by clicking on colorize check box once (second
click would render to white) We've also turned isolines and axes views, the
slice X and Y off.
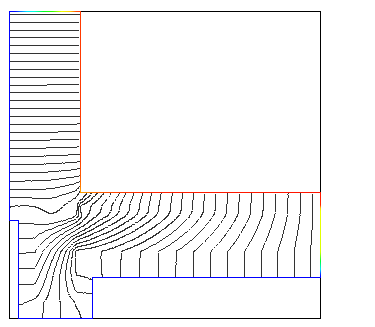
Note: Since this model contains only two spaces, the heat flowing out of interior space is the same as the heat entering exterior space. Selecting another space would therefore result in same lines being drawn.
This chapter is not finished yet. More evaluation examples shall be included here later on.
> Continue reading with "Comparing Results under Different Conditions"...