Evaluation and Output in Three Dimensions
Activate the main menu Results... option.
You will be asked to save the project data and to provide fine-grid and solver parameters. Confirm all the three dialogs with Ok.
Numeric Results
As soon as the calculation of base solutions has been terminated successfully, the Conductance-Matrix-Report is generated and shown. Also a Boundary-Condition window is revealed to receive your input for further evaluation steps - covered just below.
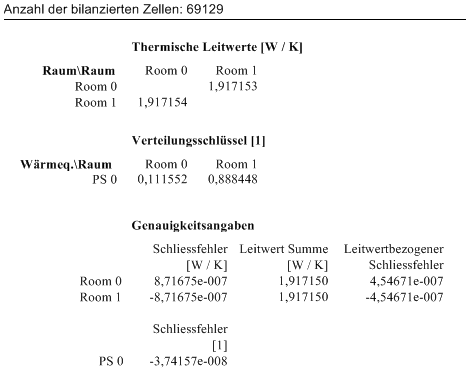
(Here again, the conductance matrix would not show symmetrical enough for some purposes; in which case, the base solutions would have to be further calculated.)
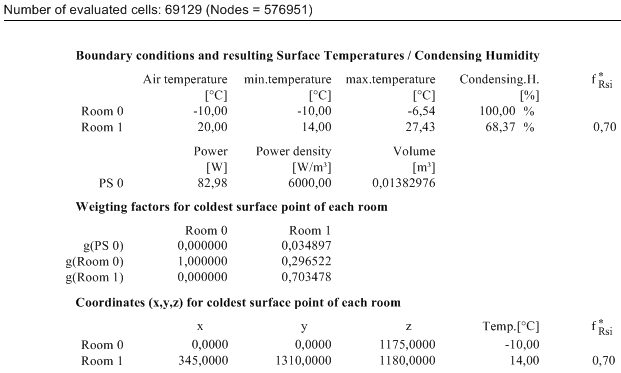
These results imply that in the corner, the heat source would lose approximately 11% of its output to the exterior space (compared to 8% for the floor regions modelled two-dimensionally).
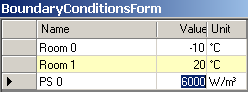
By entering same boundary conditions as for the two dimensional modelling earlier
the Evaluation results option provides:
Graphic Results
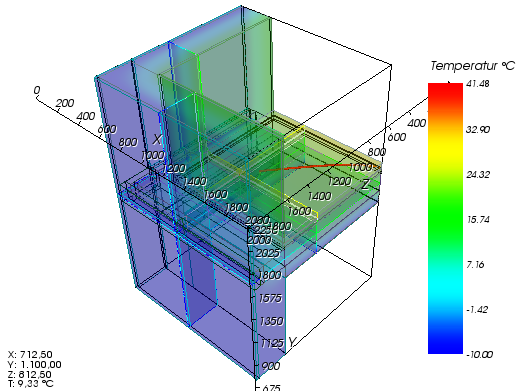
A picture of the overall temperature distribution within the component can be obtained by generating isotherm diagrams for characteristic cross-sections of the model. For this object, these are the x/y and z/y sections (see model sketches).
Within Results 3D View adjust the position of the rendering by rotating it appropriately to your need. You will eventually have to turn perspective view on within the 3D panel.
Now turn off the unneeded elements of the rendering by:
- deactivating the outline (on outline panel)
- deactivating model and model slices (on model panel)
- deactivating surface (on surface panel)
The view might be partly obscured by 3d-axes. Let them be drawn "at outer edges" on Axes panel.
To see the model boundaries (edges) turn them on (on surface panel)
Adjust colorizing range of the colorbar to 30 °C for example.
Now experiment by moving Slices X/Y/Z to emphasize the temperature distribution within the component. Right-clicking on the corresponding panel of Slice X, Y or Z exposes a context menu listing all coordinates where surfaces of the model exist. Selecting them from this context menus move the particular slice exactly to this coordinate.
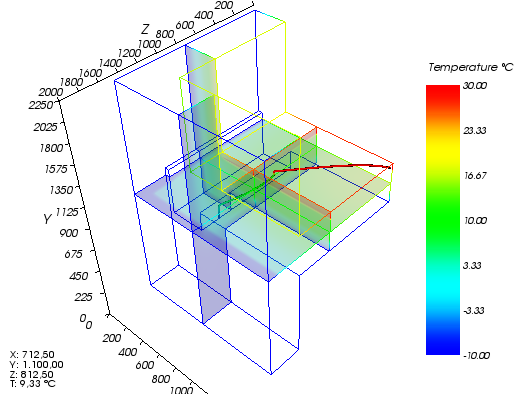
By changing the opacity of the Slices X, Y and Z you can produce more understandable results. Turn them all to fully opaque.
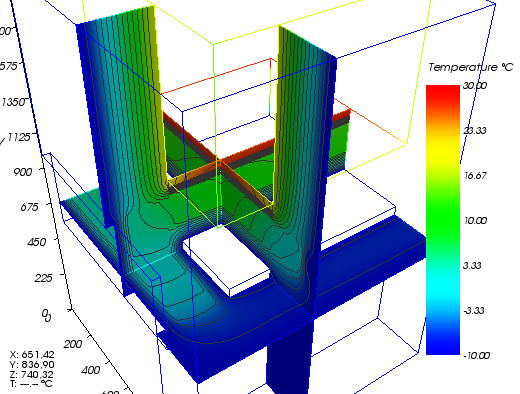
To view Isolines, turn them on, select step of 2 °C and turn colorizing to black on isoline panel. On Labels panel turn labelling off.
Continue rotating, scaling and panning the view according to your needs
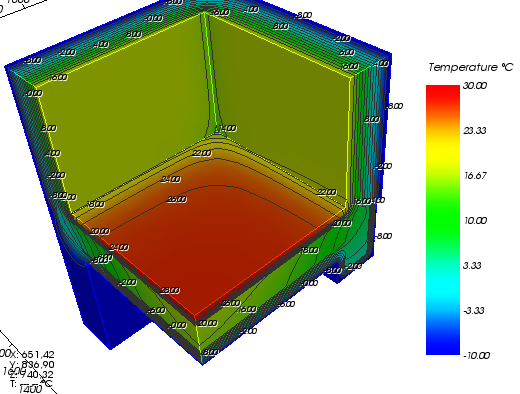
Showing the temperature distribution on the surface can be achieved by turning the surface view on and making it fully opaque (on Surface panel).
Turn Slices X/Y/Z off since their rendering are fully obscured now by the model surface and thus hidden.
Turning labelling on (Labels panel) gives more value information to the rendering. Adjust label proximity to 150 and set the "distance along line" to 1000 for reducing eventual cluttering of labels.
> Continue reading with "????"...